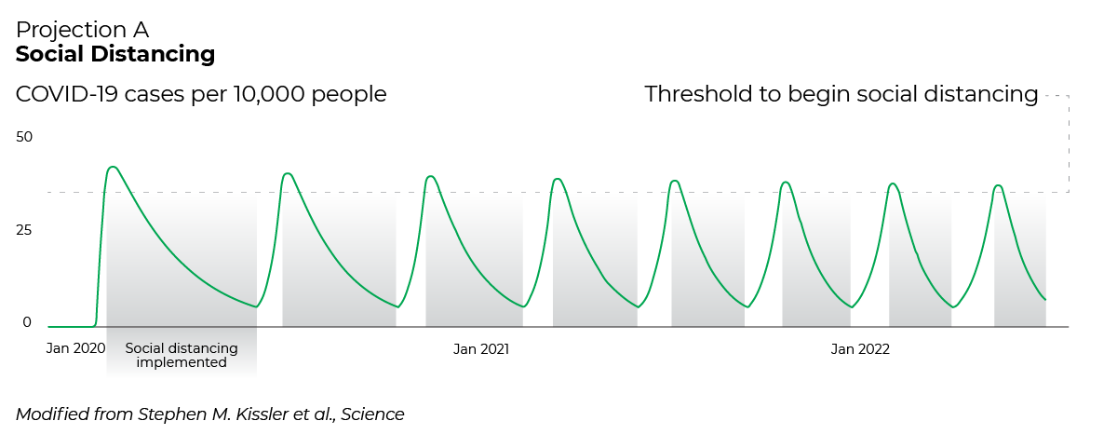
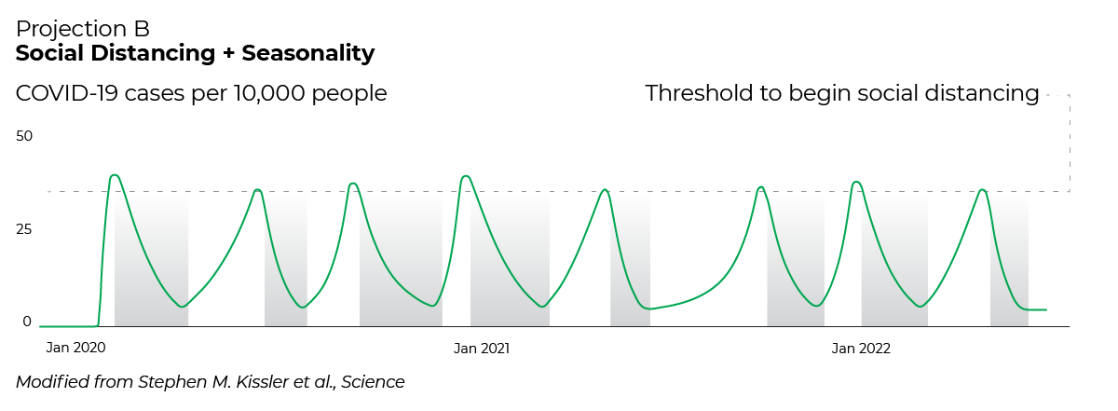
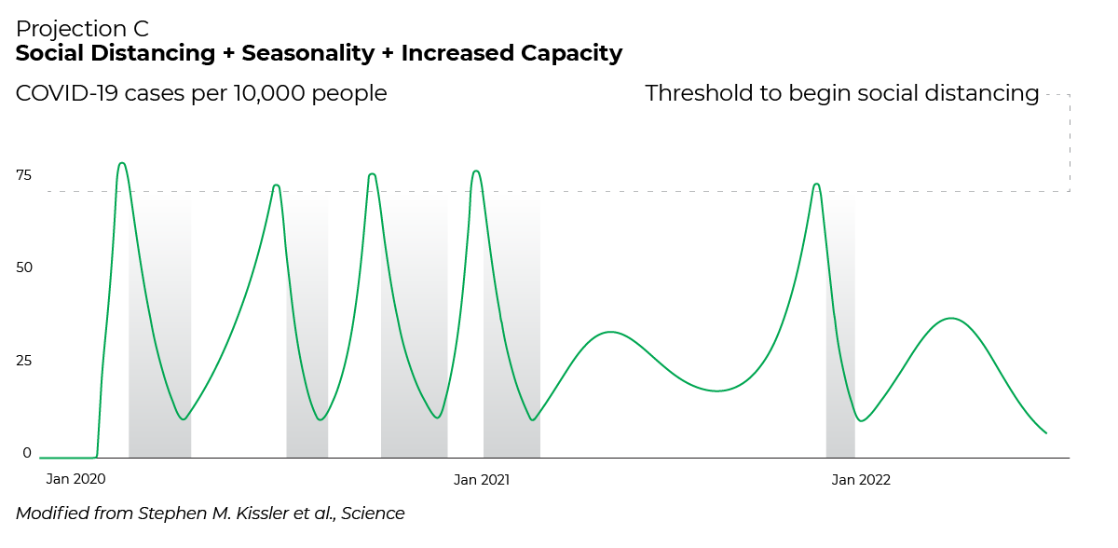
The first scenario involves a series of consistent peaks and valleys. The second predicts a seasonal peak of cases, similar to what occurred about a century ago with the Spanish flu. The third depicts a sharp peak of cases early on with a series of smaller ups and downs as cases decline.
Keep in mind: There is no one-size-fits-all projection that we can apply across every state in America. We also have to consider the different features and climates of each area, as well as the protocol that’s in place to slow the spread.
So let’s dive deeper into what would happen if certain controls were in place.
Taking Key Factors Into Account
The Center for Communicable Disease Dynamics at the Harvard T.H. Chan School of Public Health mapped out how certain factors may affect the spread of COVID-19.
Every county has implemented various measures to flatten the curve, the purpose of which is to avoid overwhelming hospitals. These initiatives include social distancing, establishing stay-at-home orders, wearing masks, contact tracing, etc.
Once cases begin to decline over a period of time, leaders can loosen restrictions until cases begin to rise toward a threshold dependent upon hospital capacity. With social distancing interventions, it would look a little something like this:


